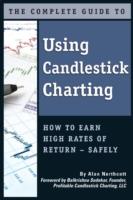
Complete Guide to Using Candlestick Charting
BücherAngebote / Angebote:
The investment world is full of different methods for understanding how to best grow your rates of return and minimise risk. The Candlestick Charting method, first developed by Japanese rice traders in the middle of the 19th century, has become one of the favourite modern methods of analysing and understanding the market through careful plotting and analysis of the data provided. This book will guide you through the seemingly complex, but revolutionarily, useful method of candlestick charting to gain the highest possible rates of return while ensuring your risks are as minimal as possible. Candlestick charting is a complex language all in itself and for that reason, this book will guide you through the entire process of understanding the language, starting with the very origins of the technique. You will learn how it was developed and why it is still used today, including what changes have been made to the methods by Western investors. You will learn how the candlestick charts are prepared and what the different line constructions signify.
Additionally, you will be shown how to read and differentiate between the different bodies, including the short and long white and black bodies, to measure high and low price levels, support, and resistance. You will be shown the various additional forms such as spinning tops, shadows, and doji. Next, the various different candle lines are outlined in full detail, showing you dozens of different formations including the single candle lines of the hammer, the hanging man, and the shooting star , the dual candle lines of dark cloud over, the piercing pattern, the engulfing pattern, last engulfing pattern, and harami. You will also learn the window candle lines, as well as the formations of three or more candle lines. Analysis of candle lines and the technical aspects, including how to discern stops, the risk/reward in each line, trends, the use of computers, and how to place and offset trades will supply you with the necessary information you need to read the candle lines.
By interviewing dozens of experts in the reading and analysis of candle charts, this book is able to provide a comprehensive perspective of candle charts and how you can start using moving averages, analysing three line break charts, renko charts, and kagi charts. You will be provided with practice charts for all three major types and additional resources to help you learn how to read and analyse each type. For anyone interested in the centuries old Japanese style of market analysis that is candlestick charting, this book provides a comprehensive overview from the very origins to the most modern of interpretations.
Folgt in ca. 15 Arbeitstagen


